CXM Trading Central
CXM offers investors Trading Central, a cutting-edge trading signal tool used by the world's largest banks and professional traders. The tool gives immediate operational advice, technical form and in-depth analysis of market changes.

Trading Central Tools
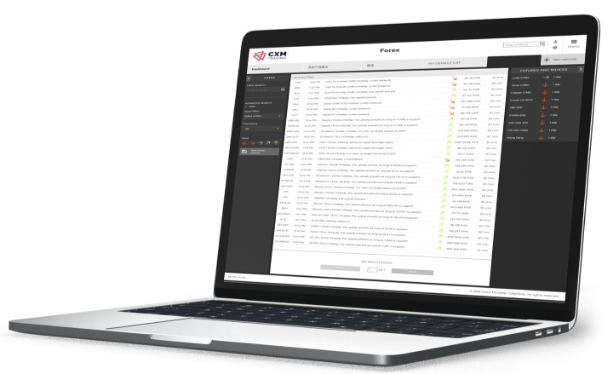
A web-based application that enables you to access TRADING CENTRAL's global research directly as it updates technical levels, targets and time-frames all assets throughout the trading day. This award-winning research portal will allow you to receive up-to-the-minute technical analysis.

Why choose Trading Central
TRADING CENTRAL (TC) is a service provider specializing in investment research and financial market technical analysis. Its offices cover the financial centers of Paris, London, New York and Hong Kong. It has provided financial market technical analysis services to 38 of the top 50 global investment banks, hedge funds, specialized traders and brokers.
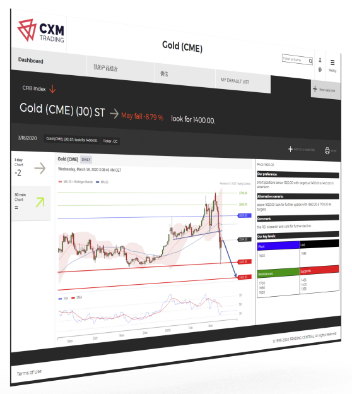
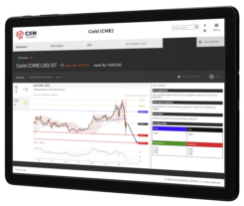
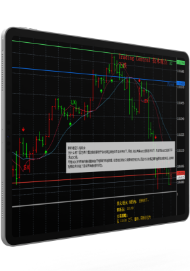
CXM & Trading Central combines candle charts with unique quantification and technical analysis, focusing on related technical graphics that are helpful for investment decisions at the current stage.

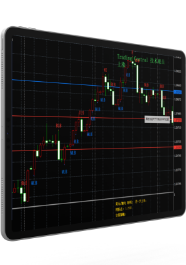
The space TC MT4 indicator can scan any chart and find 16 commonly used and selected candle technology graphics in time
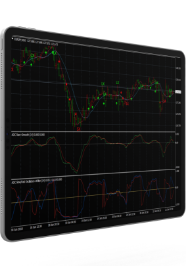
We use a moving average before weighting as a slow indicator. Fast indicators use changing weighted moving averages—trend markets have shorter cycles and longer volatile market cycles. This can be more effective, because other moving averages do trend, and often give a slower signal: observe the trend upwards, the fast indicator is above the slow indicator; or the price passes above the indicator. These are the basic elements of the adaptive divergence indicator (ADC).

For fast signals, observe the upward slope and when the ADC initial signal line is above the ADC smooth signal line, it will be a buy signal. For slow signals, observe that the ADC initial signal line and ADC smooth signal line are above the 0 line at the same time. Like the MACD indicator, the initial signal line represents the difference between the fast and slow indicators. This is the smoothed exponential moving average, but in this case, we find that the smoothed automatic length value is usually around 4, which is different from the value of the MACD indicator. Is 9.
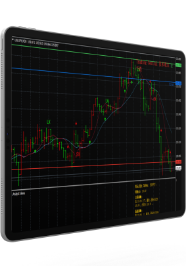
Blank labels will help remind you of trading opportunities: ↑ (buy long position), LX (long position exit), ↓ (short position buy), SX (short position exit). Signals are given based on all adaptive divergence indicators (ADC) components, including price lines, indicators and oscillators. These components can be displayed in an adaptable price data window, they are independent of each other, but we can make decisions by weight
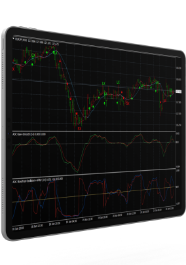
The space ADC indicator has two oscillation factors. For fast signals, observe that the fast oscillation factor will go up and above the zero line. For slow signals, observe that the fast oscillation factor is above the slow factor, or observe that the slope of the slow oscillation factor is upward and below the fast factor, and is higher than the adaptive variable
Leave your analysis to the experts, you can directly use the analysis results of CXM & Trading Central to help you trade. You can intuitively understand our trend views and target points. At the same time, you can find alternative strategies. Through our turning point, we will tell you when to change the trend view and give the target price of the alternative strategy.


